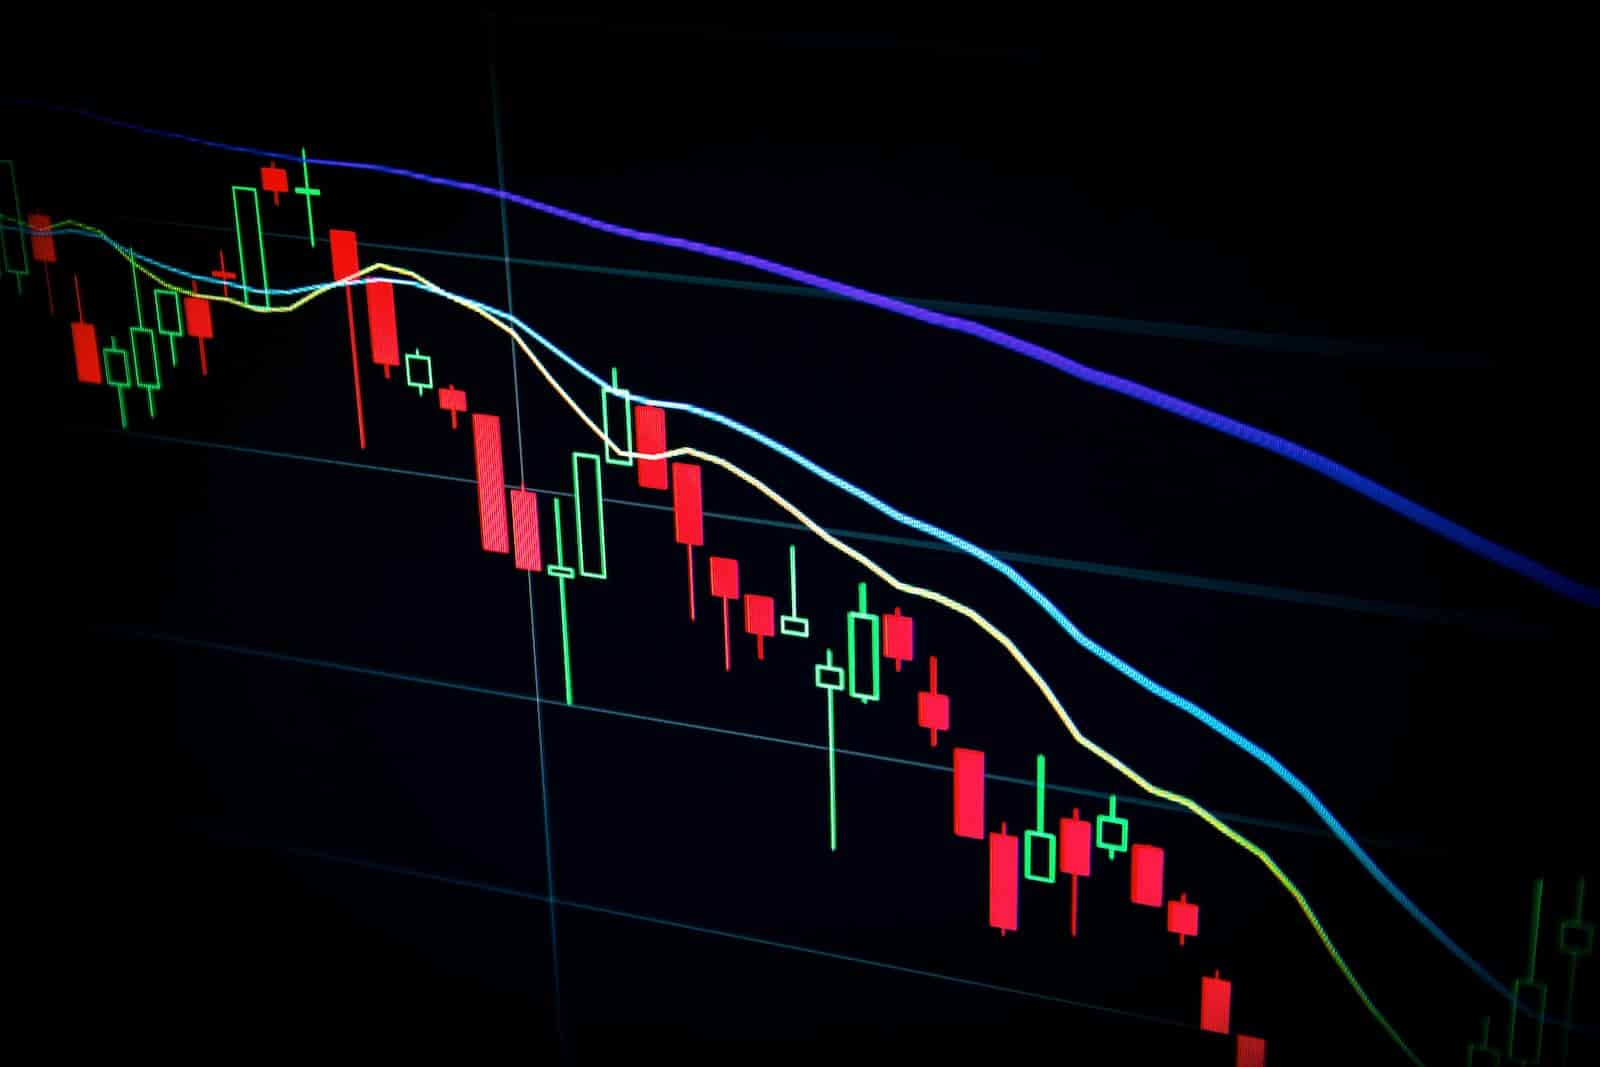
As a trader in today’s complex markets, it can be challenging to keep up with all the information and strategies that are available.
Thankfully, having the right technical indicators at your disposal can help simplify things – allowing you to build a reliable trading toolkit as you increase your knowledge of the markets. Some of them can be founded on trading platforms like MT4 and MT5, so you can go to indicators right after choosing a platform.
We will discuss 5 crucial technical indicators which should form an integral part of any trader’s analysis process when attempting to maximize gains while minimizing losses. Here we go.
- On-Balance Volume
The On-Balance Volume (OBV) indicator is a powerful tool used to measure the positive and negative flow of volume in an asset over time. It works by calculating a running total, adding up any ‘’up’’ volumes – determined when prices rise – while subtracting down volumes from days where prices fell. This allows traders to make more informed decisions based on shifts in buying or selling pressure behind the security being analyzed.
- Average Direction Index
The Average Direction Index (ADX) is a valuable tool for traders to measure the strength of an existing trend. When it’s above 40, there is a strong directional movement that can be used as a signal to enter or exit positions in the market. And when below 20, weak momentum may indicate no clear direction and suggest caution before trading.
- Moving Average Convergence Divergence
The MACD indicator is a powerful tool for traders to identify trend direction and momentum. It consists of 2 lines, the MACD line and the signal line, which help detect price movements. When the former crosses below the latter it signals that prices are falling while crossing above indicates an upward phase. By utilizing this helpful visual aid in their trading strategies, traders can make informed decisions on buying or selling positions with greater accuracy.
- Stochastic Oscillator
The Stochastic Oscillator is an indicator that tracks the current price relative to its range over a specified number of periods. It moves up and down quickly, as it’s unusual for prices to maintain either extreme highs or lows. The values above 80 are considered overbought while those below 20 indicate being oversold. As such, this oscillator can be used as a guide in determining when markets may have reached their peak (or trough) levels – allowing traders better insight into potential buying and selling opportunities.
- Relative Strength Index
The Relative Strength Index (RSI) is a useful tool for traders, as it provides an indication of momentum and trend strength. With RSI levels ranging from 0 to 100, assets are typically considered overbought when the indicator moves above 70 and is potentially due for a decline. Similarly if below 30 they may be seen as oversold with the potential to rally. To maximize results however some wait until after these thresholds have been breached before making any trades.
Conclusion
These are just a few technical indicators that can help you build your trading toolkit. As you become more familiar with the markets, you will develop your own preferences and style. The important thing is to have a variety of tools at your disposal so that you can adapt to any situation. So don’t be afraid to experiment and add these indicators to your trading arsenal.

